Last Updated on July 15, 2020 by Madelein Wolfaardt

Know exactly how much money you are making – line-by-line in real-time.
Calculates the gross profit, cost, markup percentage and more.

Last Updated on July 15, 2020 by Madelein Wolfaardt
Know exactly how much money you are making – line-by-line in real-time.
Calculates the gross profit, cost, markup percentage and more.
Go to Stock Items > Stock Turnover
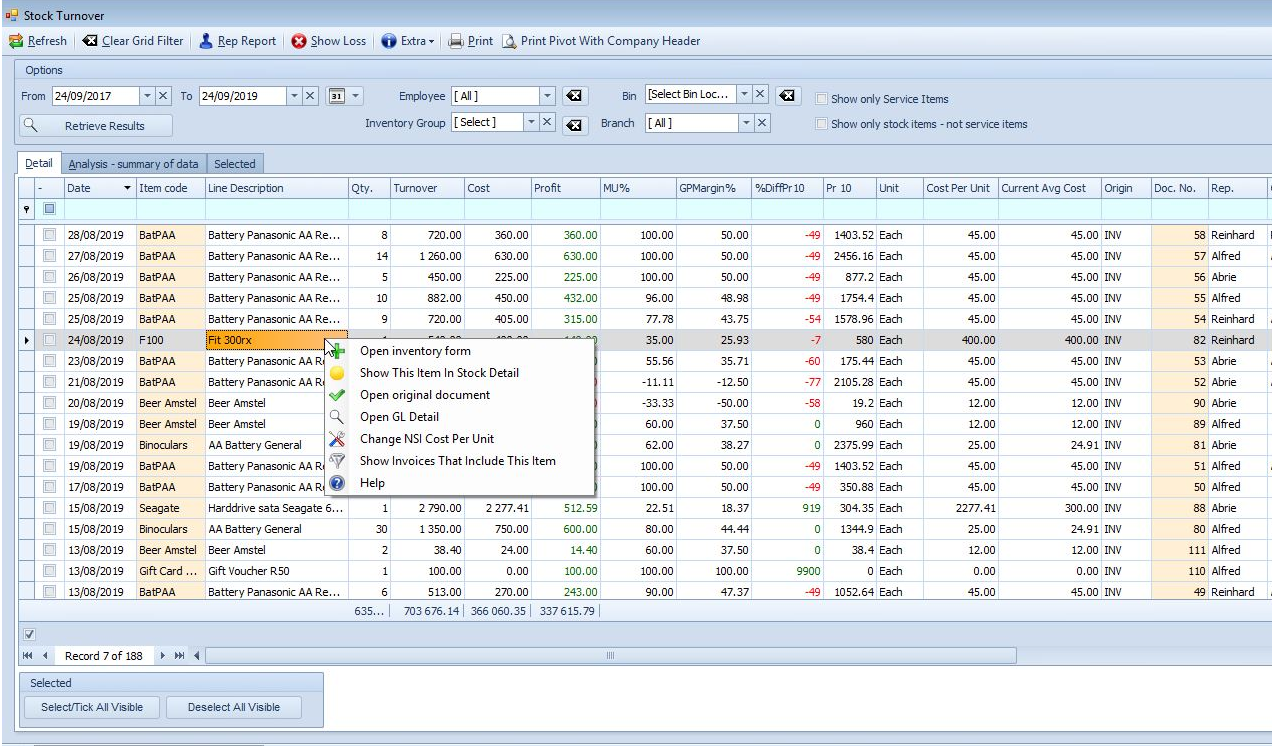
Aim of this report:
To get a summary of data and pull various reports such as sales per salesperson, per item, best sellers and top customers. The report can be manipulated to suit your specific needs. There are pre-set reports, but they can also be changed to suit your needs.
All reports can be changed to suit your needs.
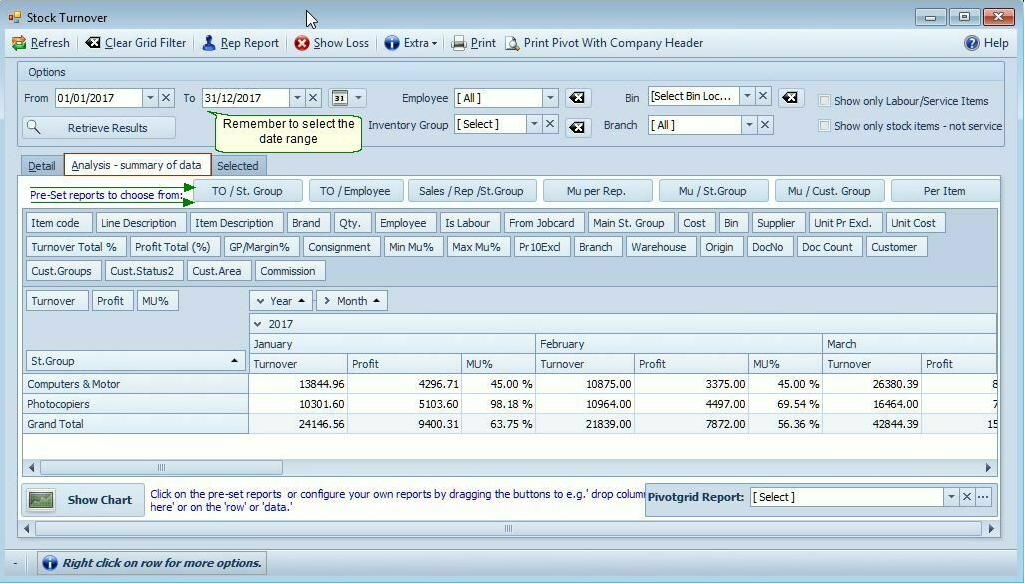
Please contact us if you need help setting up your own custom reports.